
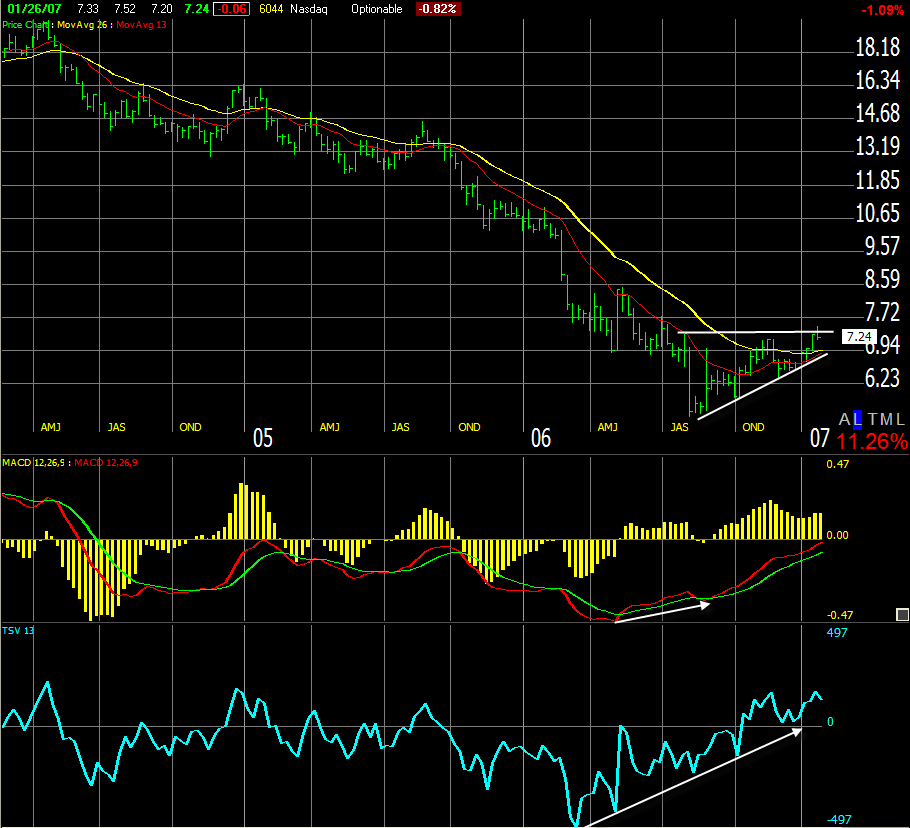
ROIAK or Radio One Inc., the radio station owner and operator, just made it on my watch list. As usual, I am sticking to fairly cheap instruments. The weekly charts tells me ROIAK may have formed a bottom last August, making it an attractive long. The current weekly trend is up and the impulse signal is green meaning the MACD histogram slope is up and the EMA is also trending up. So we have both momentum and inertia favoring the bulls. The weekly chart also formed a small bullish divergence between the May 06 bottom and August 06 bottom where the MACD traced a higher bottom.
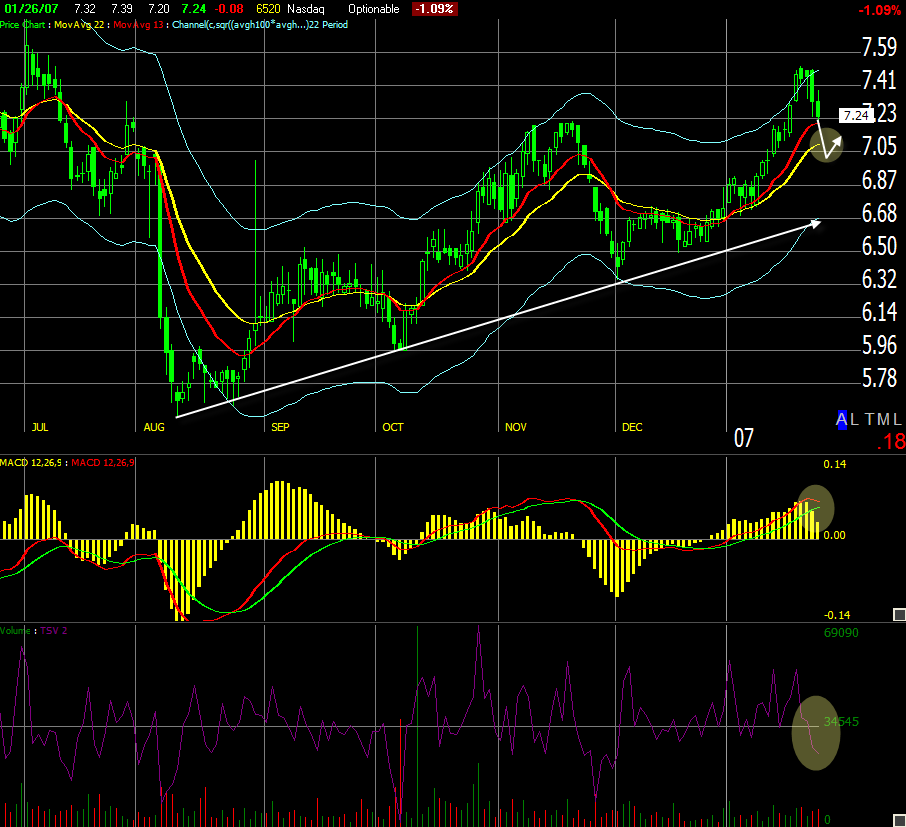
The next step is to see when I could enter this trade on the daily chart. The chart shows a recent uptrend started around August, the pre-determined bottom from the weekly chart. A pullback started three or four bars ago the best scenario right now would be for the pullback to reach between the EMA line and the lower channel line before turning around. The current impulse signal is blue but since the MACD histogram slope is down and the EMA has started leveling, we could get a couple red bars before the pullback is over and we start heading up. As soon as I get a signal the pullback is over and the uptrend is about to resume, it would be time to jump in long.
Remember that right now is earning seasons so double and triple-check every instruments. Even though I favor the technical aspects of trading, staying on top of the major news does not hurt.
Happy Trading!