
A down day on major indicators of the market today breaking a two day rally. I am taking down my long-term for now. I am sticking to short-term which is from the 60-minutes chart and the intermediate which I get from the daily chart. Please take not these notation are subject to my own interpretation.
The current rally was interrupted by a drop and with the futures down and the news overall negative I think the down movement will extend in tomorrow’s (2/29) trading session.
| Intermediate | Short-term | ||
| NASDAQ | Sideways | Down | |
| Dow | Sideways | Down | |
| S&P | Sideways | Down | |
 |
 |
||
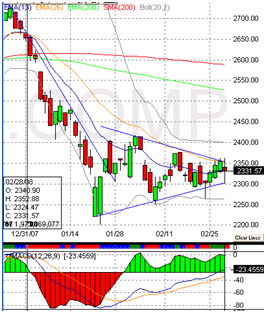
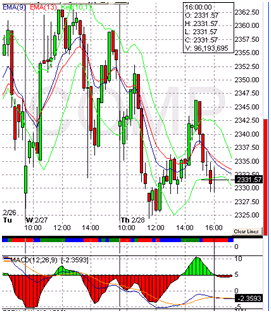
| The NASDAQ is clearly still sideways in a wedge. We will need more then the short rally. | The 60 minute chart of the NASDAQ Composite shows how choppy short term movements can get in these markets. | ||
 |
 |
||
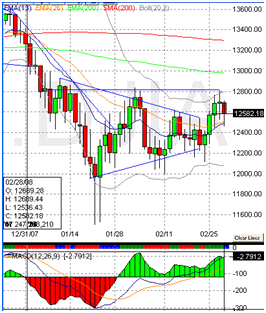
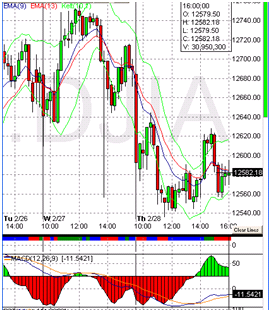
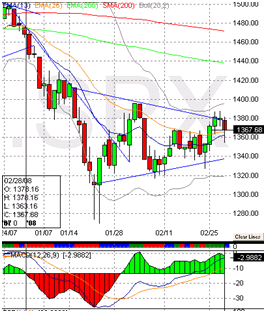
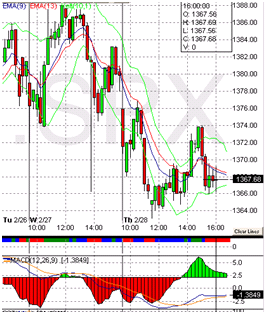
| I did have to adjust the DOW chart. I left the old wedge line for now but I am looking at rising triangle forming at the moment. This is positive, the symetrical triangle was continuation OR reversal, the rising triangle is more bullish. | The 60-minutes charts again shows how choppy markets get. | ||
 |
 |
||
| Like with the NASDAQ, the S&P is in the symmetrical triangle (wedge) still. | All three 60-minutes charts pretty much follow each other. I clearly see this down move extending into tomorrow (2/29). | ||
Happy Trading!