
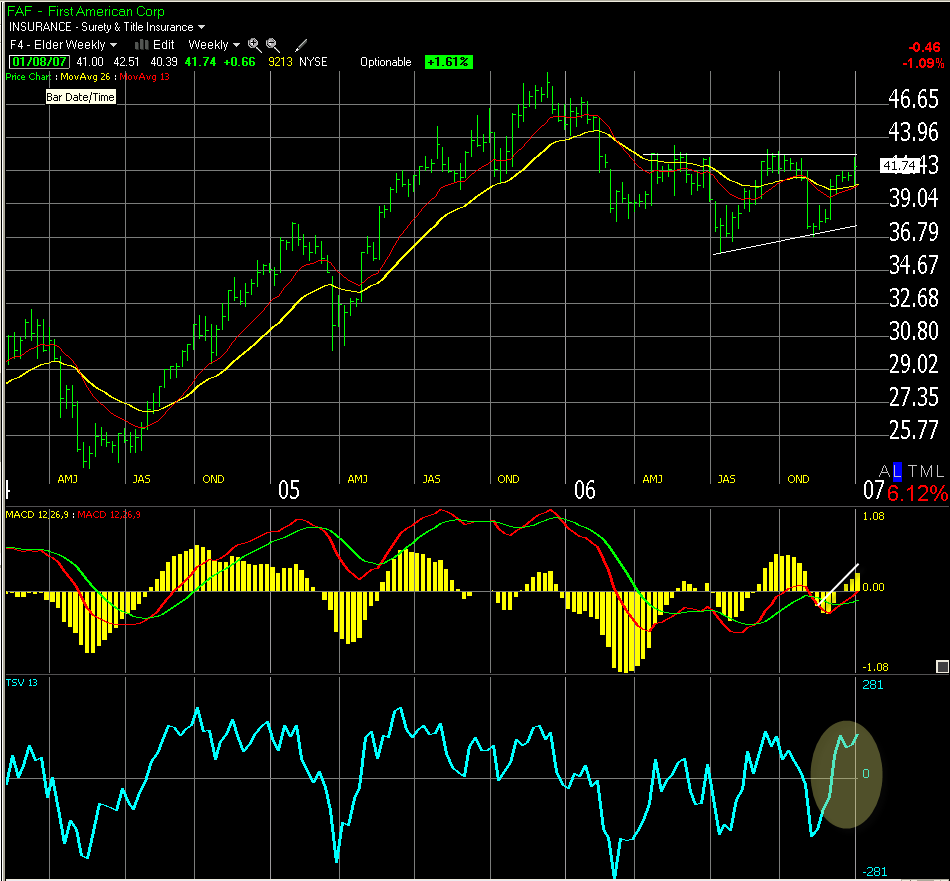
Reading charts tonight I fell on FAF which attracted my attention and would consider getting in around 42.10 with a stop around 40.39. The weekly chart shows a potential uptrend with the EMA trending up and the MACD histogram slope is also up (Elder‘s Impulse System). On the daily chart I see the same pattern: EMA trending up and MACD histogram sloping up also. The TSV recently crossed under which could indicate a good entry point.
On the weekly chart, I see a trend up in the last weeks which could break-out. Currently the EMA is sloping up and the MACD Histogram is also sloping which gives you the green light from Elder‘s Impulse System.
The daily chart shows a similar situation with EMA trending up and the MACD histogram also trending up. The daily chart also has the TSV crossing below zero which could indicate a good opportunity to get in if the trend maintains.
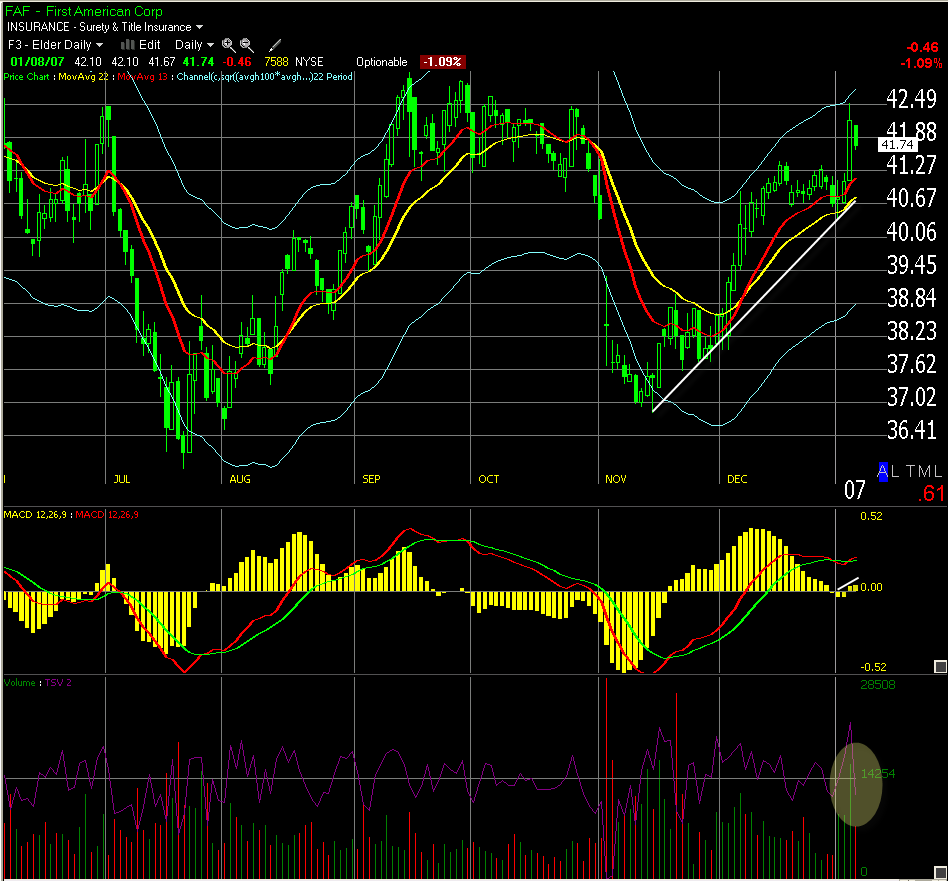
I would approach this with caution (like every trade) but would definitely consider getting in long around 42.10 placing an initial stop around 40.39 to see how the game plays out.