
I do not own SAM nor will I get in at this point but if I was, I would short SAM below yestersday’s low of 34.28. I know I am a day behind Wallstrip here but I guess recovering from the holidays has been harder than I thought. And please watch the Wallstrip Show on SAM and follow up with the blog.
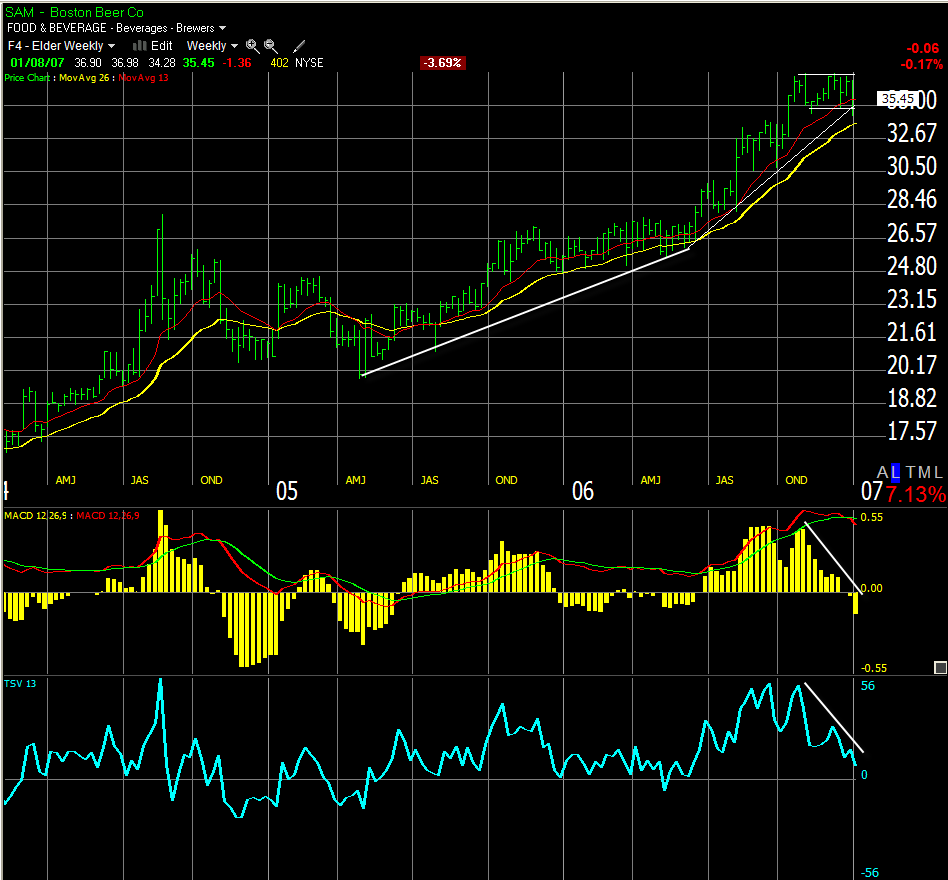
SAM‘s weekly chart shows clear signs of bearish momentum with the EMA trending down and the MACD histogram slope heading down also.
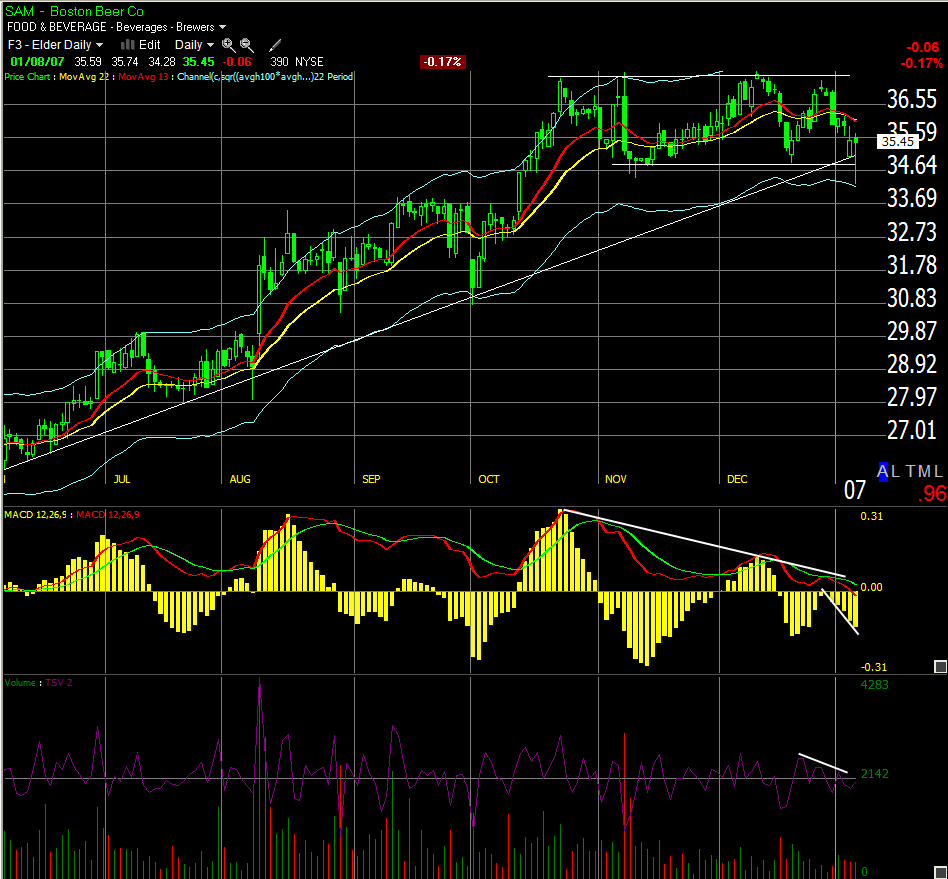
On the daily charts, we clearly see SAM uptrend topped out late october and the stock has been trading in range since. Constantly bouncing between a 36.50 high and 34.50 low. SAM looks now like it could be trying to reach lower lows and start a downtrend. The EMA is heading down the MACD histogram is sloping down also. Each peak to the 36.50 high (the one in early November, early December and late December) has seen less volume and the MACD histogram has traced lower highs for each. SAM could be running out of gas.