
Following Wallstrip’s daily video on NKE, here is a quick analysis of Nike’s chart. Keep in mind I own no Nike and do not plan on aquiring any. I am doing this for practice which means I am very green when it comes to analysis like this.
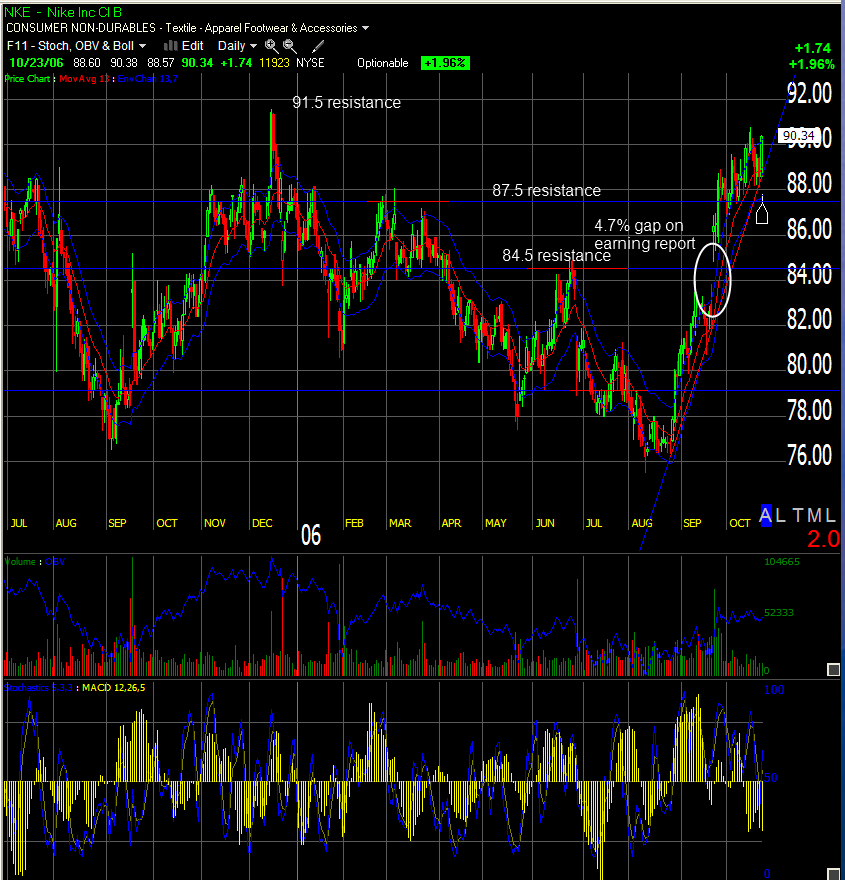
Nike has been in a very nice uptrend since late august. This trend included a 4.7% jump on positive earnings report on September 22nd. Looking at a year and a half of daily data, we see NKE break through two prior resistance levels, around 84.5 and around 87.5. The next step for Nike is the 91.5 prior high from December of 2005.
At the moment, the volume is declining and the MACD histogram has turned, showing less and less support for the trend. As a result, the price has pulled back towards the trendline and the 13 days MA line.
At this turning point, I would not get invovled with NKE. I would wait for a confirmation of movement in either direction. The trend could resume increasing the price away from the MA line, which would make Nike attractive for a long position and would more than likely take the price through the 91.5 resistance. Or the price could break downwards through the trendline and make the instrument attractive for a short. In case of down movement, the price would probably look for support around the prior resistance level, around 87.5.