

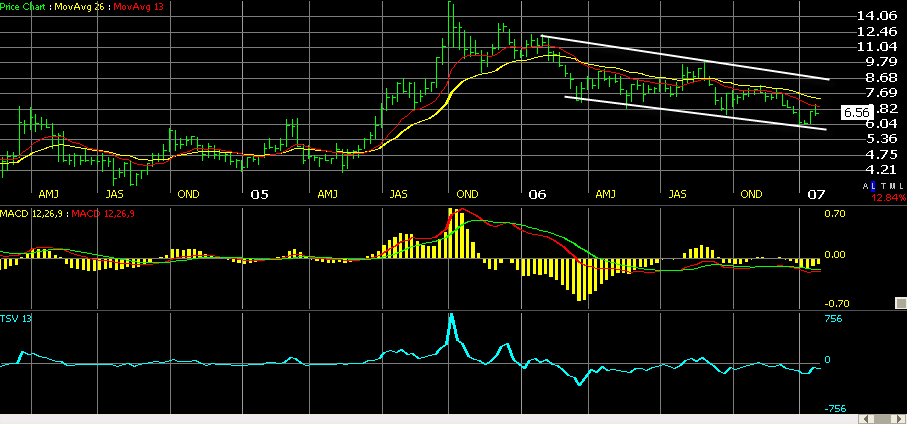
I will be watching the progress of NGAS in the coming week. The weekly chart gives a blue impulse signal which is not ideal but permits me to trade long if I so desire. The MACD histogram is up but the EMA still shows a down trend. I think the weekly primary trend is down but chart shows regular upswing so I could trade this between the channel lines.
Here is weekly chart:
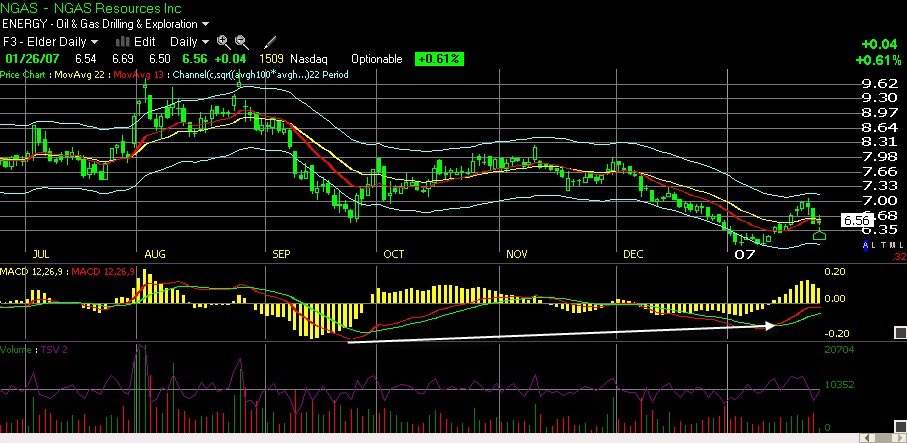
Daily chart shows MACD bullish divergence between the Sept 06 and Jan 07 bottoms which could indicate a reversal soon. The bears are running out of steam and the bulls are tempted to take over. Early January we saw the price bounce from the lower channel to the upper one. I would like to see the pullback finish below the EMA lines to around 6.35 and get in on a bounce, riding it up to 7.33. The worst (aside from I am way off and it sinks) is I can ride this between channels catching an upswing. The very best case, the upswing breaks out and I stay long for a bit.
A quick reminder that this is earnings season so check every potential trade. A quick check over at InstantBull for news and I do not see NGAS reporting in the upcoming week. Being in the energy sector, NGAS could be influenced by the sector’s performance.
Happy Trading.